
Client reference
MND
MND is one of the largest Czech energy groups, producing oil and natural gas and operating its own power generation. Energy production and consumption across the group is now tracked in a single report built by SBID.
Problem
Energy production and consumption in separate readings
Solution
Group-wide energy reporting in Power BI
3
Types of generation sources in one overview
1
Overview of the whole group's production and consumption
10+
Views from group level down to a single plant
Plan
Actual production and consumption always against plan
A group with its own power plants needs to know how much energy it produces, how much its companies consume and how both compare to plan. MND now covers this with a single Power BI report that joins readings from solar plants, cogeneration units and gas-to-power sources with the consumption of individual companies and their offtake points.
Problem: every source and offtake in its own records
Production from solar, cogeneration and gas-to-power sources was tracked separately, while the consumption of group companies and their offtake points lived in metering exports. Assembling the full picture of how much the group produces and where it consumes meant a lot of manual work in Excel.
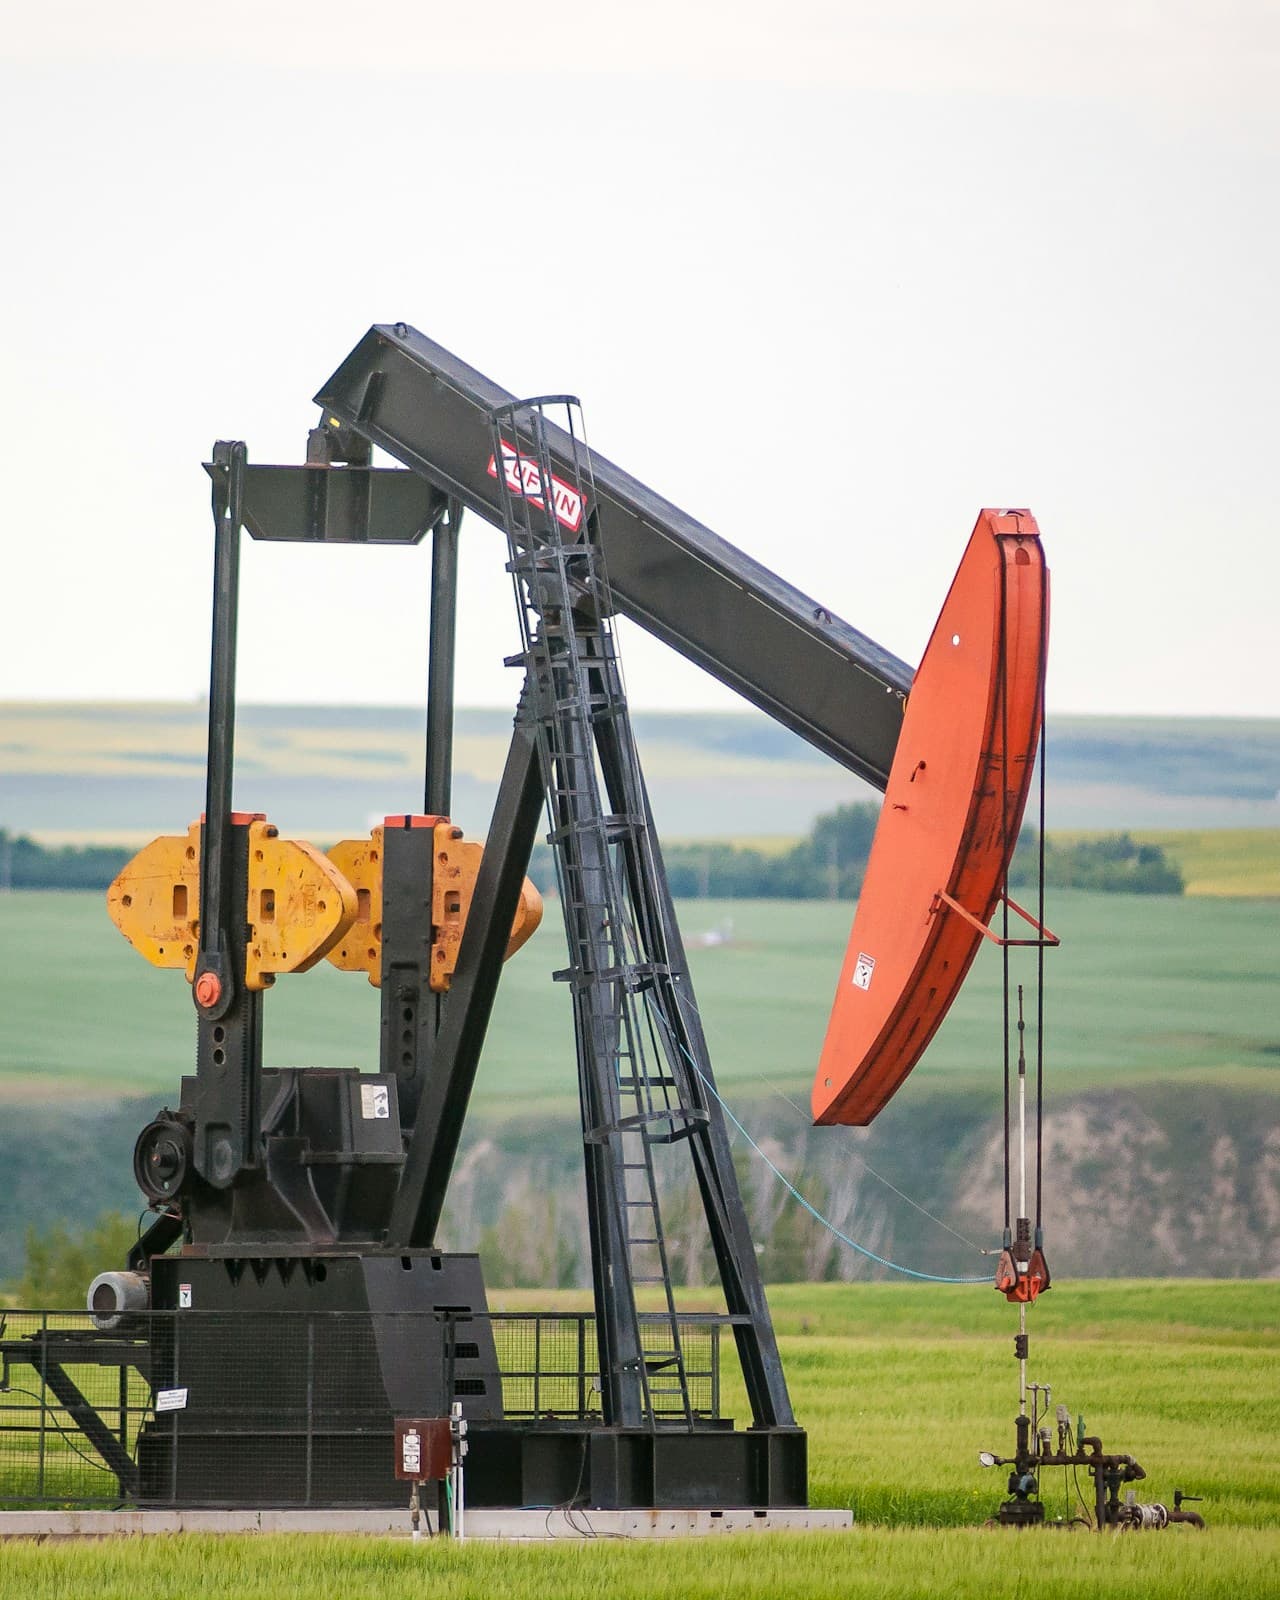
Solution: one data model for production and consumption
SBID built a data model joining electricity meter readings, the output of individual sources and production and consumption plans. On top of it runs a report with group-wide views:
- Main overview: the group's production and consumption on one screen
- Production by source type: solar, cogeneration and gas-to-power, always against plan
- Consumption by company and offtake point, always against the consumption plan
- Consumption over time, from a yearly overview down to individual days
- Detailed views of individual plants and comparisons between them
Result: the group's energy under control
- Production and consumption of the whole group in one place
- Immediate comparison of actuals against plan for every source
- Plant performance can be compared side by side
- Every company sees the consumption of its offtake points and how it develops
- A basis for managing the group's energy instead of manual spreadsheets
What we used on this project